11 Mar For this assignment, you will reconstruct the Income Statement Analysis. I attached the examples from the book below (document
For this assignment, you will reconstruct the Income Statement Analysis. I attached the examples from the book below (document 1), use the formulas which are provided in the book. An example of the solution is also provided (document 2).
The second part of this assignment applies a simulation. The second tab of the spreadsheet provides the information and a solution (keep in mind this is a simulation based on the parameters for sales units so your numbers will not be the same) to the income statement where the number of units sold is assumed to have a normal distribution with the given parameters. This is not the format and summary statistics for the net income that is required. Also, in your model, develop a histogram of your solution. These are all shown in the example.
As usual, your model should include proper documentation and instructions and other information expected of well-constructed models/spreadsheets. The example solution could be improved upon so do not just use that as a guide for your submission.
Keep in mind, we could have used distributions for other variables as well. This may be the first time you have used probability distributions for modeling so the goal is to get you used to the tools. More complicated models would simply add more uncertainty.
9.4.2 Example 2—An Income Statement Analysis
We now consider a slightly more complex model for scenario analysis. In this example, we focus on a standard income statement and a related set of scenarios that are provided by a decision maker. The decision maker would like to determine the bottom-line (net profit) that results from various combinations of input values. In Fig. 9.17 we can see that we have 7 input variables, and each variable has two possible values. This is not a particularly complex problem, but with a greater number of possible input values, this problem could easily become quite cumbersome. The 7 input values represent standard inputs that are often estimated in proforma Income Statement analysis:
· Sales Revenue = (Volume)*(Price)
· COGS = (percentage 4 )*(Sales Revenue)
· Variable Operating Expense = (percentage)*(Sales Revenue)
· Fixed Operating Expenses
· Depreciation Expense
· Interest Expense
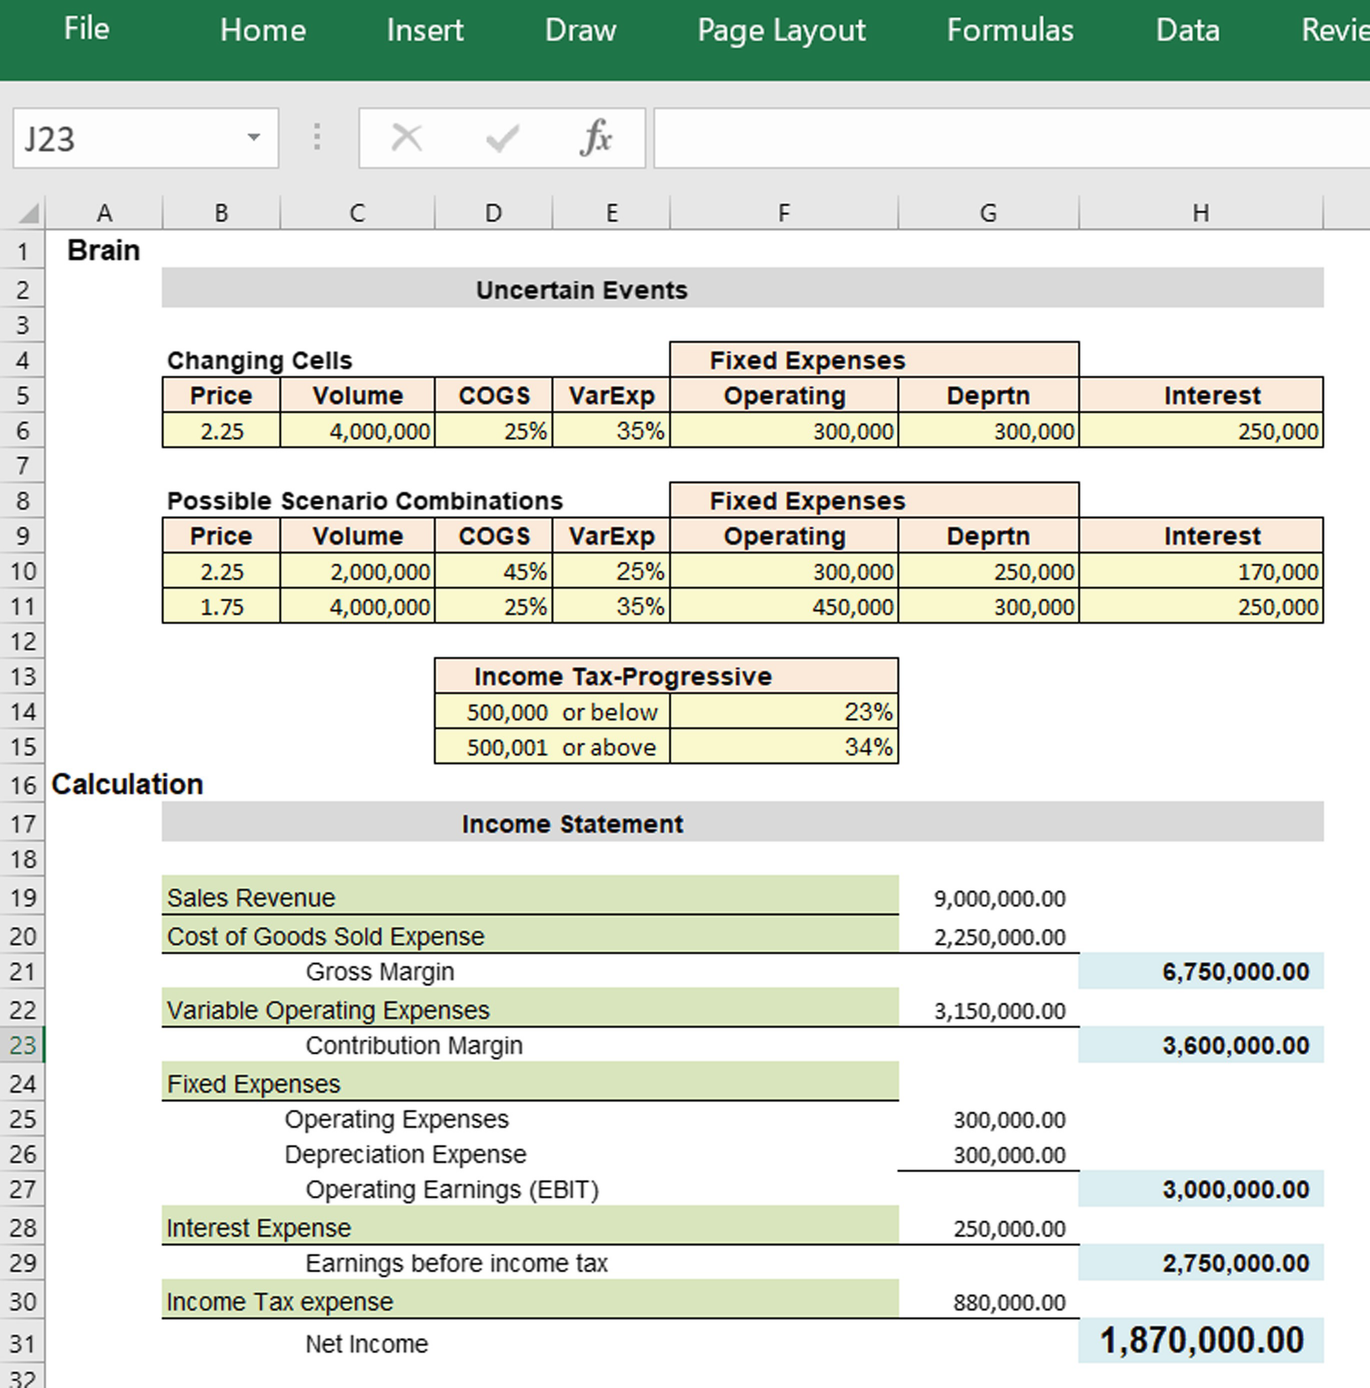
Fig. 9.17
Income statement analysis example
Obviously, we cannot use a two variable Data Table for this type of analysis; there are too many variables to consider simultaneously. This example is an excellent use of the Scenarios tools. Figure 9.18 shows the results of the 4 scenarios. They range from a loss of $300,000 to a gain of $2,417,800.
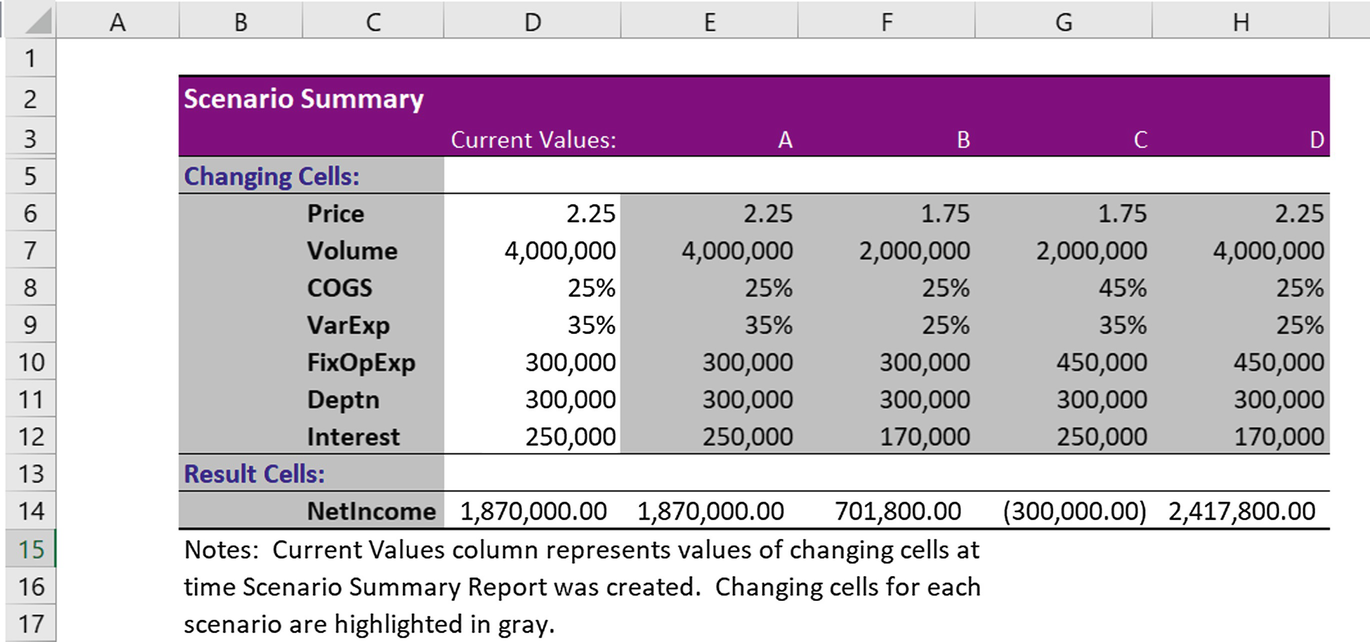
Fig. 9.18
Income statement scenarios
,
Simplified Income Statement
| Simplified Income Statement | ||||||||||||
| Changing Cells | Fixed Expenses | |||||||||||
| Price | Volume | COGS (pct) | VarExp (pct) | Operating | Depr | Interest Exp | 1. Use Solver to answer the question: What volume of sales is necessary to achieve 0 net income (break -even volume) for a sales price of 2.25 | |||||
| 2.25 | 4,000,000 | 25 | 35 | 300000 | 300000 | 250000 | ||||||
| Record answer here: | ||||||||||||
| Income Statement | ||||||||||||
| Sales Revenue | 9,000,000.00 | 2. Use Solver to answer the question: What price of sales is necessary to achieve 0 net income (break even volume) for a volume of 4,000,000 | ||||||||||
| Cost of Good Sold Expense | 2,250,000.00 | |||||||||||
| Gross Margin | 6,750,000.00 | Record answer here: | ||||||||||
| Variable Operating Expenses | 3,150,000.00 | |||||||||||
| Contribution Margin | 3,600,000.00 | |||||||||||
| Fixed Expenses | ||||||||||||
| Operating Expenses | 300,000.00 | |||||||||||
| Depreciaiton Expense | 300,000.00 | |||||||||||
| Operating Earnings (EBIT*) | 3,000,000.00 | |||||||||||
| Interest Expense | 250,000.00 | |||||||||||
| 2,750,000.00 | ||||||||||||
| Income Tax Expense (use tax rate of 32 pct) | 880,000.00 | |||||||||||
| Net Income | 1,870,000.00 | |||||||||||
| * EBIT – earnings before interest and tax | ||||||||||||
| This income statement assumes no taxe shields for interest or depreciaiton expenses | ||||||||||||
| This income statement assumes tax rate is 32 percent |
Simplified In Statment Scenario
| Simplified Income Statement | Observation | Units | Price | Revenue | COGS (pct of rev) | Var Op Exp | Fixed Op Exp | Interest Exp | Depr Exp | EBT | Taxes | Net Income | ||||||||||||
| 1 | 1,910,369 | 2.25 | 4,298,330.74 | 1,074,582.69 | 1,504,415.76 | 300,000.00 | 250,000.00 | $ 300,000.0 | 869,332.30 | 278,186.34 | 591,145.96 | |||||||||||||
| Uncertain Events | 2 | 1,121,822 | 2.25 | 2,524,099.39 | 631,024.85 | 883,434.79 | 300,000.00 | 250,000.00 | $ 300,000.0 | 159,639.76 | 51,084.72 | 108,555.04 | (250,000.00) | Bin | Frequency | |||||||||
| 3 | 3,165,407 | 2.25 | 7,122,165.90 | 1,780,541.48 | 2,492,758.07 | 300,000.00 | 250,000.00 | $ 300,000.0 | 1,998,866.36 | 639,637.24 | 1,359,229.13 | 0 | (250,000.00) | 1 | ||||||||||
| Changing Cells | Fixed Expenses | 4 | 3,549,116 | 2.25 | 7,985,510.30 | 1,996,377.58 | 2,794,928.61 | 300,000.00 | 250,000.00 | $ 300,000.0 | 2,344,204.12 | 750,145.32 | 1,594,058.80 | 250,000 | – 0 | 1 | ||||||||
| Price | Volume | COGS (pct) | VarExp (pct) | Operating | Depr | Interest Exp | 5 | 1,860,330 | 2.25 | 4,185,742.55 | 1,046,435.64 | 1,465,009.89 | 300,000.00 | 250,000.00 | $ 300,000.0 | 824,297.02 | 263,775.05 | 560,521.97 | 500,000 | 250,000.00 | 2 | |||
| 2.25 | 4,000,000 | 25 | 35 | 300000 | 300000 | 250000 | 6 | 1,604,601 | 2.25 | 3,610,351.69 | 902,587.92 | 1,263,623.09 | 300,000.00 | 250,000.00 | $ 300,000.0 | 594,140.68 | 190,125.02 | 404,015.66 | 750,000 | 500,000.00 | 3 | |||
| 7 | 567,692 | 2.25 | 1,277,307.12 | 319,326.78 | 447,057.49 | 300,000.00 | 250,000.00 | $ 300,000.0 | (339,077.15) | (108,504.69) | (230,572.46) | 1,000,000 | 750,000.00 | 13 | ||||||||||
| Sales (units) | 2,500,000 | mean | 8 | 659,476 | 2.25 | 1,483,820.98 | 370,955.24 | 519,337.34 | 300,000.00 | 250,000.00 | $ 300,000.0 | (256,471.61) | (82,070.91) | (174,400.69) | 1,250,000 | 1,000,000.00 | 7 | |||||||
| 1,000,000 | std deviation | 9 | 1,864,364 | 2.25 | 4,194,818.88 | 1,048,704.72 | 1,468,186.61 | 300,000.00 | 250,000.00 | $ 300,000.0 | 827,927.55 | 264,936.82 | 562,990.74 | 1,500,000 | 1,250,000.00 | 11 | ||||||||
| 10 | 4,411,007 | 2.25 | 9,924,766.59 | 2,481,191.65 | 3,473,668.31 | 300,000.00 | 250,000.00 | $ 300,000.0 | 3,119,906.64 | 998,370.12 | 2,121,536.51 | 1,750,000 | 1,500,000.00 | 3 | ||||||||||
| 11 | 3,954,135 | 2.25 | 8,896,803.94 | 2,224,200.98 | 3,113,881.38 | 300,000.00 | 250,000.00 | $ 300,000.0 | 2,708,721.58 | 866,790.90 | 1,841,930.67 | 2,000,000 | 1,750,000.00 | 3 | ||||||||||
| 12 | 2,691,935 | 2.25 | 6,056,854.61 | 1,514,213.65 | 2,119,899.11 | 300,000.00 | 250,000.00 | $ 300,000.0 | 1,572,741.85 | 503,277.39 | 1,069,464.46 | 2,250,000 | 2,000,000.00 | 3 | ||||||||||
| Tax Rate (pct) | 32 | 13 | 3,019,017 | 2.25 | 6,792,789.35 | 1,698,197.34 | 2,377,476.27 | 300,000.00 | 250,000.00 | $ 300,000.0 | 1,867,115.74 | 597,477.04 | 1,269,638.70 | 2,500,000 | 2,250,000.00 | 1 | ||||||||
| 14 | 3,127,444 | 2.25 | 7,036,748.56 | 1,759,187.14 | 2,462,862.00 | 300,000.00 | 250,000.00 | $ 300,000.0 | 1,964,699.43 | 628,703.82 | 1,335,995.61 | 2,750,000 | 2,500,000.00 | 1 | ||||||||||
| 15 | 2,398,679 | 2.25 | 5,397,027.05 | 1,349,256.76 | 1,888,959.47 | 300,000.00 | 250,000.00 | $ 300,000.0 | 1,308,810.82 | 418,819.46 | 889,991.36 | 3,000,000 | 2,750,000.00 | 1 | ||||||||||
| 16 | 3,181,488 | 2.25 | 7,158,347.37 | 1,789,586.84 | 2,505,421.58 | 300,000.00 | 250,000.00 | $ 300,000.0 | 2,013,338.95 | 644,268.46 | 1,369,070.49 | 3,000,000.00 | 0 | |||||||||||
| 17 | 1,979,422 | 2.25 | 4,453,699.89 | 1,113,424.97 | 1,558,794.96 | 300,000.00 | 250,000.00 | $ 300,000.0 | 931,479.95 | 298,073.59 | 633,406.37 | More | 0 | |||||||||||
| Income Statement | 18 | 2,671,121 | 2.25 | 6,010,021.94 | 1,502,505.48 | 2,103,507.68 | 300,000.00 | 250,000.00 | $ 300,000.0 | 1,554,008.77 | 497,282.81 | 1,056,725.97 | ||||||||||||
| Sales Revenue | 9,000,000.00 | 19 | 1,737,359 | 2.25 | 3,909,056.86 | 977,264.21 | 1,368,169.90 | 300,000.00 | 250,000.00 | $ 300,000.0 | 713,622.74 | 228,359.28 | 485,263.47 | |||||||||||
| Cost of Good Sold Expense | 2,250,000.00 | 20 | 2,920,834 | 2.25 | 6,571,875.98 | 1,642,969.00 | 2,300,156.59 | 300,000.00 | 250,000.00 | $ 300,000.0 | 1,778,750.39 | 569,200.13 | 1,209,550.27 | |||||||||||
| Gross Margin | 6,750,000.00 | 21 | 2,219,771 | 2.25 | 4,994,484.88 | 1,248,621.22 | 1,748,069.71 | 300,000.00 | 250,000.00 | $ 300,000.0 | 1,147,793.95 | 367,294.06 | 780,499.89 | |||||||||||
| Variable Operating Expenses | 3,150,000.00 | 22 | 2,469,371 | 2.25 | 5,556,084.19 | 1,389,021.05 | 1,944,629.47 | 300,000.00 | 250,000.00 | $ 300,000.0 | 1,372,433.68 | 439,178.78 | 933,254.90 | |||||||||||
| Contribution Margin | 3,600,000.00 | 23 | 2,778,138 | 2.25 | 6,250,809.56 | 1,562,702.39 | 2,187,783.35 | 300,000.00 | 250,000.00 | $ 300,000.0 | 1,650,323.82 | 528,103.62 | 1,122,220.20 | |||||||||||
| Fixed Expenses | 24 | 3,728,344 | 2.25 | 8,388,774.39 | 2,097,193.60 | 2,936,071.04 | 300,000.00 | 250,000.00 | $ 300,000.0 | 2,505,509.76 | 801,763.12 | 1,703,746.64 | ||||||||||||
| Operating Expenses | 300,000.00 | 25 | 2,475,416 | 2.25 | 5,569,686.99 | 1,392,421.75 | 1,949,390.45 | 300,000.00 | 250,000.00 | $ 300,000.0 | 1,377,874.80 | 440,919.94 | 936,954.86 | |||||||||||
| Depreciation Expense | 300,000.00 | 26 | 1,717,867 | 2.25 | 3,865,200.73 | 966,300.18 | 1,352,820.25 | 300,000.00 | 250,000.00 | $ 300,000.0 | 696,080.29 | 222,745.69 | 473,334.60 | |||||||||||
| Operating Earnings (EBIT*) | 3,000,000.00 | 27 | 4,107,712 | 2.25 | 9,242,351.79 | 2,310,587.95 | 3,234,823.13 | 300,000.00 | 250,000.00 | $ 300,000.0 | 2,846,940.72 | 911,021.03 | 1,935,919.69 | |||||||||||
| Interest Expense | 250,000.00 | 28 | 2,020,958 | 2.25 | 4,547,155.15 | 1,136,788.79 | 1,591,504.30 | 300,000.00 | 250,000.00 | $ 300,000.0 | 968,862.06 | 310,035.86 | 658,826.20 | |||||||||||
| EBT | 2,750,000.00 | 29 | 2,268,680 | 2.25 | 5,104,530.79 | 1,276,132.70 | 1,786,585.78 | 300,000.00 | 250,000.00 | $ 300,000.0 | 1,191,812.32 | 381,379.94 | 810,432.38 | |||||||||||
| Income Tax Expense | 880,000.00 | 30 | 720,972 | 2.25 | 1,622,186.36 | 405,546.59 | 567,765.22 | 300,000.00 | 250,000.00 | $ 300,000.0 | (201,125.46) | (64,360.15) | (136,765.31) | |||||||||||
| Net Income | 1,870,000.00 | 31 | 1,800,611 | 2.25 | 4,051,374.95 | 1,012,843.74 | 1,417,981.23 | 300,000.00 | 250,000.00 | $ 300,000.0 | 770,549.98 | 246,575.99 | 523,973.99 | |||||||||||
| 32 | 1,278,086 | 2.25 | 2,875,693.38 | 718,923.34 | 1,006,492.68 | 300,000.00 | 250,000.00 | $ 300,000.0 | 300,277.35 | 96,088.75 | 204,188.60 | |||||||||||||
| 33 | 1,337,626 | 2.25 | 3,009,657.78 | 752,414.44 | 1,053,380.22 | 300,000.00 | 250,000.00 | $ 300,000.0 | 353,863.11 | 113,236.20 | 240,626.92 | |||||||||||||
| 34 | 2,011,072 | 2.25 | 4,524,912.04 | 1,131,228.01 | 1,583,719.22 | 300,000.00 | 250,000.00 | $ 300,000.0 | 959,964.82 | 307,188.74 | 652,776.08 | |||||||||||||
| * EBIT – earnings before interest and tax | 35 | 1,892,926 | 2.25 | 4,259,082.92 | 1,064,770.73 | 1,490,679.02 | 300,000.00 | 250,000.00 | $ 300,000.0 | 853,633.17 | 273,162.61 | 580,470.55 | ||||||||||||
| 36 | 2,564,195 | 2.25 | 5,769,439.31 | 1,442,359.83 | 2,019,303.76 | 300,000.00 | 250,000.00 | $ 300,000.0 | 1,457,775.73 | 466,488.23 | 991,287.49 | |||||||||||||
| 37 | 4,037,199 | 2.25 | 9,083,697.67 | 2,270,924.42 | 3,179,294.19 | 300,000.00 | 250,000.00 | $ 300,000.0 | 2,783,479.07 | 890,713.30 | 1,892,765.77 | |||||||||||||
| 38 | 426,336 | 2.25 | 959,257.00 | 239,814.25 | 335,739.95 | 300,000.00 | 250,000.00 | $ 300,000.0 | (466,297.20) | (149,215.10) | (317,082.10) | |||||||||||||
| 39 | 2,318,042 | 2.25 | 5,215,593.44 | 1,303,898.36 | 1,825,457.70 | 300,000.00 | 250,000.00 | $ 300,000.0 | 1,236,237.38 | 395,595.96 | 840,641.42 | |||||||||||||
| 40 | 4,349,238 | 2.25 | 9,785,784.41 | 2,446,446.10 | 3,425,024.54 | 300,000.00 | 250,000.00 | $ 300,000.0 | 3,064,313.76 | 980,580.40 | 2,083,733.36 | |||||||||||||
| 41 | 2,354,852 | 2.25 | 5,298,418.03 | 1,324,604.51 | 1,854,446.31 | 300,000.00 | 250,000.00 | $ 300,000.0 | 1,269,367.21 | 406,197.51 | 863,169.70 | |||||||||||||
| 42 | 2,290,113 | 2.25 | 5,152,753.76 | 1,288,188.44 | 1,803,463.82 | 300,000.00 | 250,000.00 | $ 300,000.0 | 1,211,101.51 | 387,552.48 | 823,549.02 | |||||||||||||
| 43 | 818,291 | 2.25 | 1,841,155.80 | 460,288.95 | 644,404.53 | 300,000.00 | 250,000.00 | $ 300,000.0 | (113,537.68) | (36,332.06) | (77,205.62) | |||||||||||||
| 44 | 1,762,733 | 2.25 | 3,966,149.29 | 991,537.32 | 1,388,152.25 | 300,000.00 | 250,000.00 | $ 300,000.0 | 736,459.71 | 235,667.11 | 500,792.61 | |||||||||||||
| 45 | 4,047,958 | 2.25 | 9,107,905.74 | 2,276,976.44 | 3,187,767.01 | 300,000.00 | 250,000.00 | $ 300,000.0 | 2,793,162.30 | 893,811.94 | 1,899,350.36 | |||||||||||||
| 46 | 2,176,886 | 2.25 | 4,897,993.55 | 1,224,498.39 | 1,714,297.74 | 300,000.00 | 250,000.00 | $ 300,000.0 | 1,109,197.42 | 354,943.17 | 754,254.24 | |||||||||||||
| 47 | 1,794,678 | 2.25 | 4,038,025.90 | 1,009,506.48 | 1,413,309.07 | 300,000.00 | 250,000.00 | $ 300,000.0 | 765,210.36 | 244,867.32 | 520,343.05 | |||||||||||||
| 48 | 2,950,842 | 2.25 | 6,639,395.04 | 1,659,848.76 | 2,323,788.26 | 300,000.00 | 250,000.00 | $ 300,000.0 | 1,805,758.02 | 577,842.57 | 1,227,915.45 | |||||||||||||
| 49 | 2,283,136 | 2.25 | 5,137,056.97 | 1,284,264.24 | 1,797,969.94 | 300,000.00 | 250,000.00 | $ 300,000.0 | 1,204,822.79 | 385,543.29 | 819,279.49 | |||||||||||||
| 50 | 1,839,610 | 2.25 | 4,139,123.39 | 1,034,780.85 | 1,448,693.19 | 300,000.00 | 250,000.00 | $ 300,000.0 | 805,649.36 | 257,807.79 | 547,841.56 | |||||||||||||
| Max | 2,121,536.51 | |||||||||||||||||||||||
| Min | (317,082.10) | |||||||||||||||||||||||
| Avg (mean) | 856,984.28 | |||||||||||||||||||||||
| St Deviation | 610,840.14 | |||||||||||||||||||||||
| Loss count | 5 | |||||||||||||||||||||||
| Profit count | 45 |
Histogram
Frequency (250,000.00) – 250,000.00 500,000.00 750,000.00 1,000,000.00 1,250,000.00 1,500,000.00 1,750,000.00 2,000,000.00 2,250,000.00 2,500,000.00 2,750,000.00 3,000,000.00 More 1 1 2 3 13 7 11 3 3 3 1 1 1 0 0
Bin
Frequency
Our website has a team of professional writers who can help you write any of your homework. They will write your papers from scratch. We also have a team of editors just to make sure all papers are of HIGH QUALITY & PLAGIARISM FREE. To make an Order you only need to click Ask A Question and we will direct you to our Order Page at WriteEdu. Then fill Our Order Form with all your assignment instructions. Select your deadline and pay for your paper. You will get it few hours before your set deadline.
Fill in all the assignment paper details that are required in the order form with the standard information being the page count, deadline, academic level and type of paper. It is advisable to have this information at hand so that you can quickly fill in the necessary information needed in the form for the essay writer to be immediately assigned to your writing project. Make payment for the custom essay order to enable us to assign a suitable writer to your order. Payments are made through Paypal on a secured billing page. Finally, sit back and relax.
Do you need help with this question?
Get assignment help from WriteEdu.com Paper Writing Website and forget about your problems.
WriteEdu provides custom & cheap essay writing 100% original, plagiarism free essays, assignments & dissertations.
With an exceptional team of professional academic experts in a wide range of subjects, we can guarantee you an unrivaled quality of custom-written papers.
Chat with us today! We are always waiting to answer all your questions.